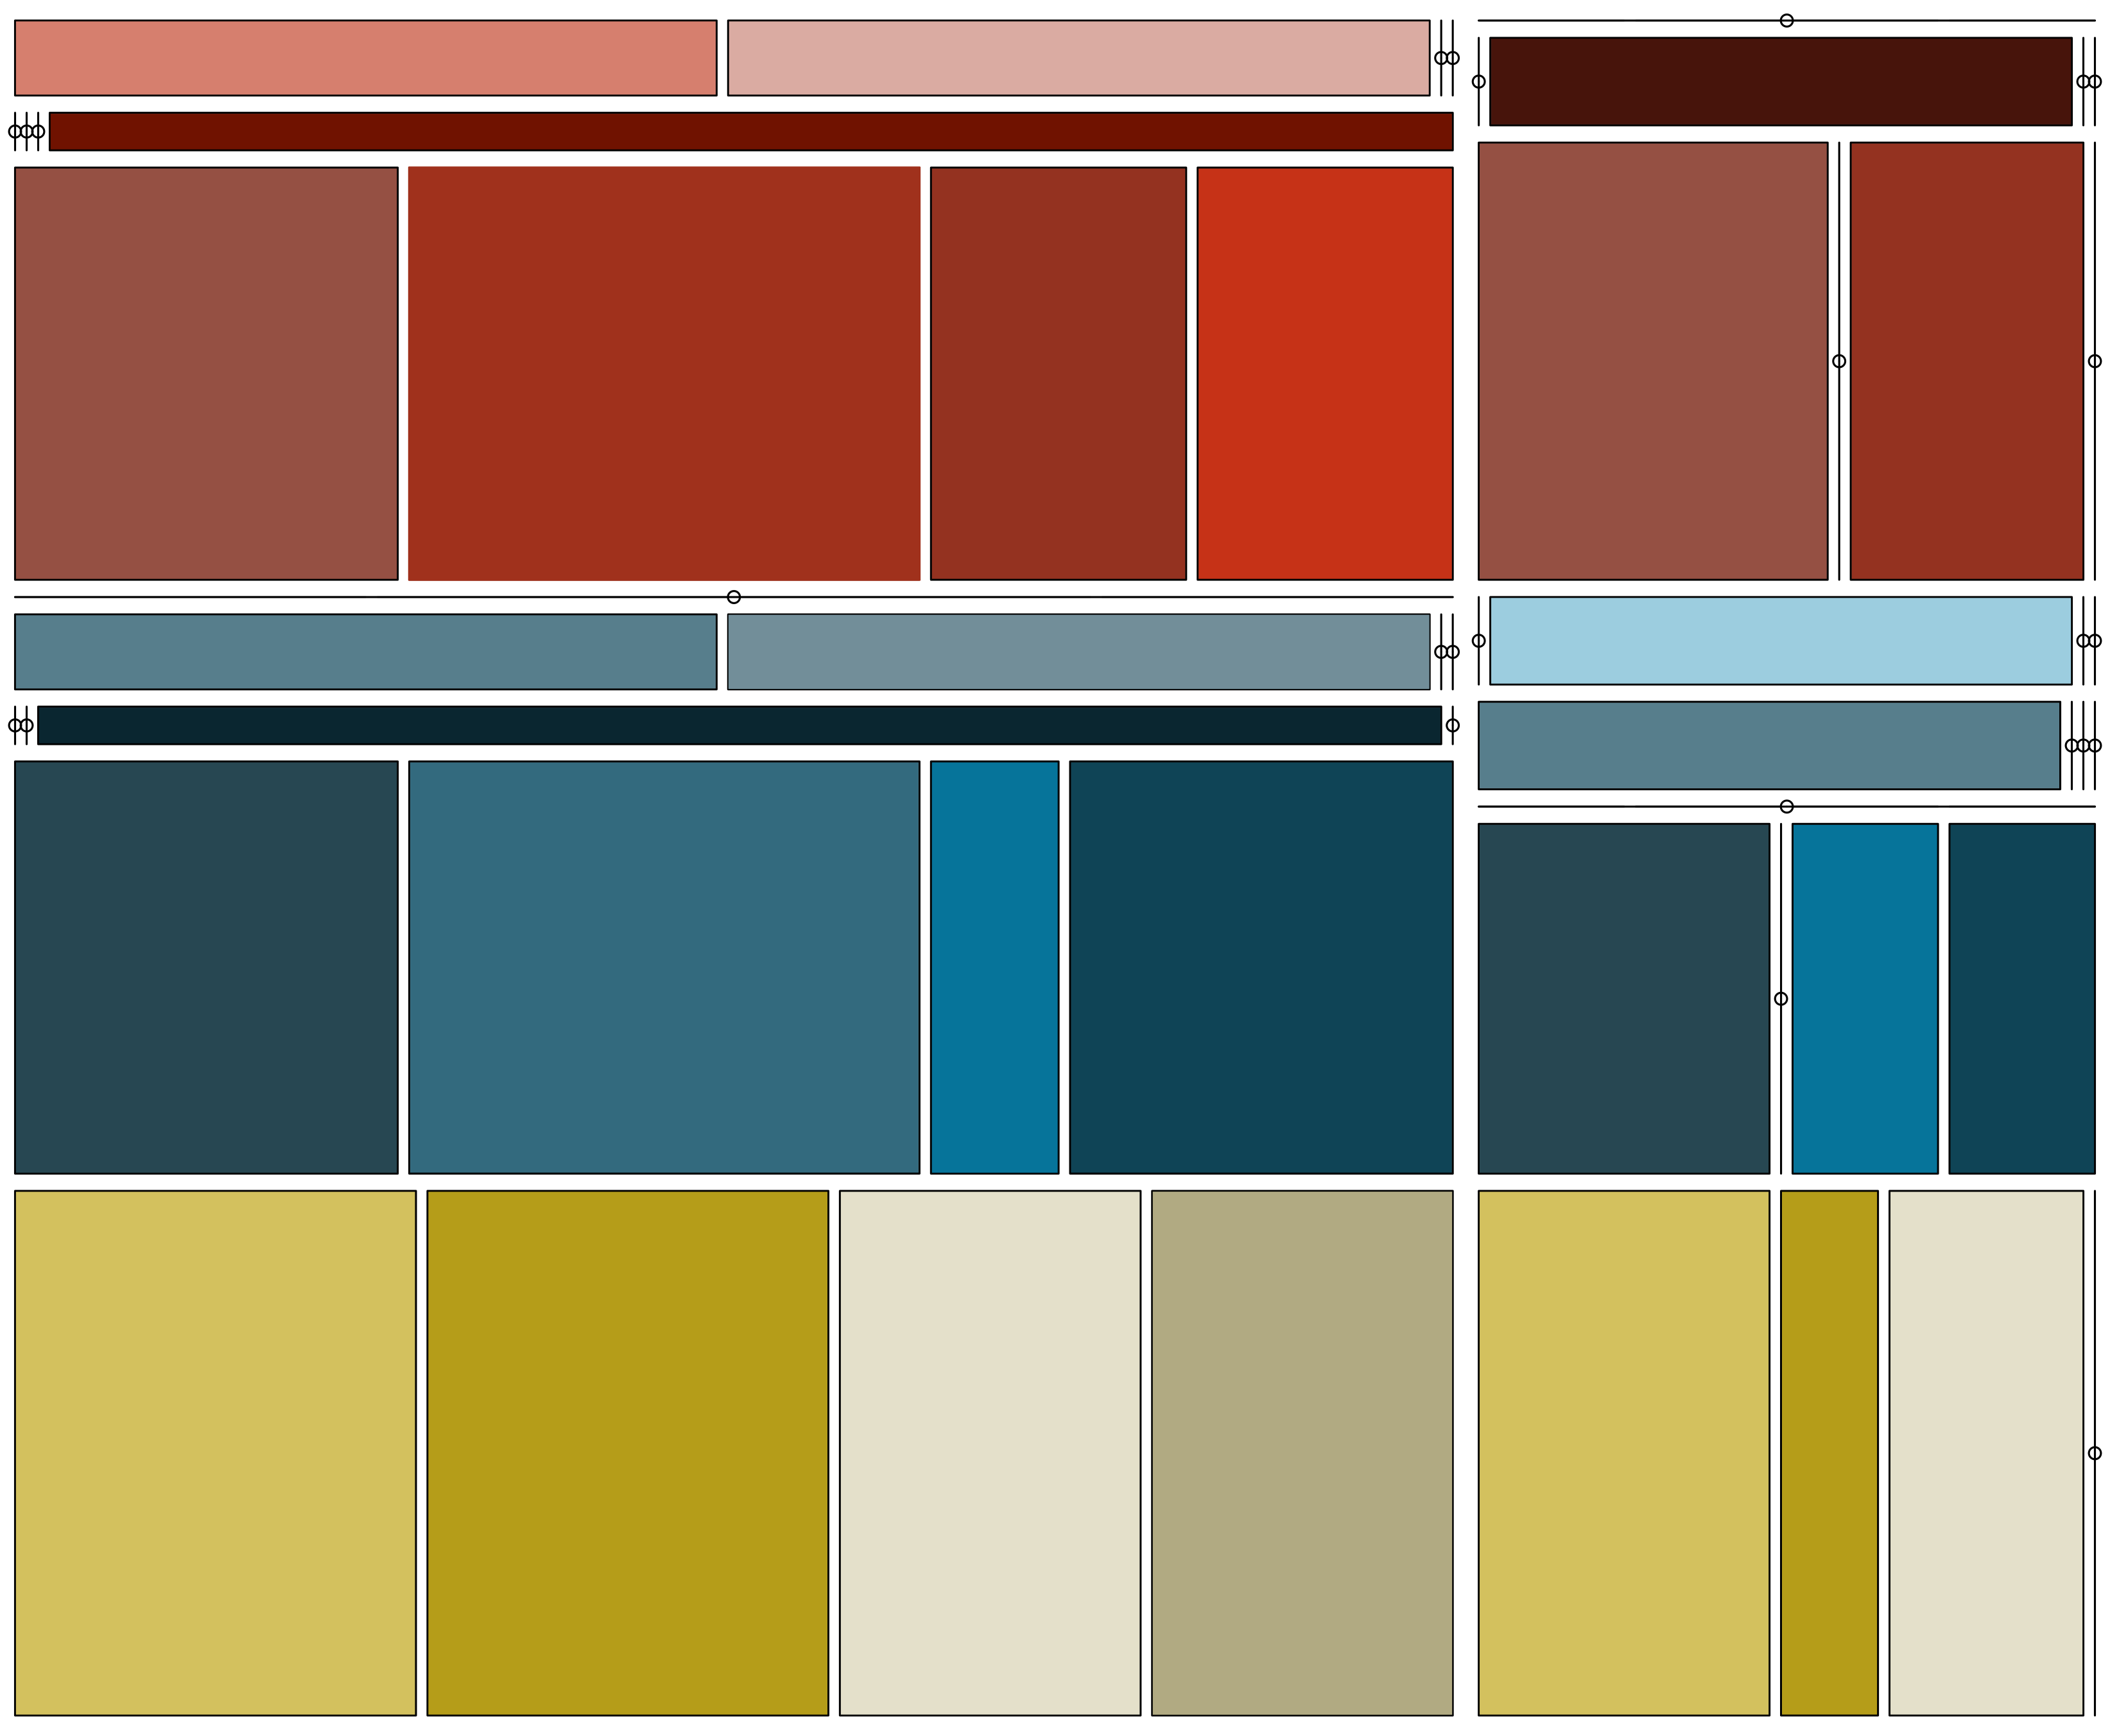
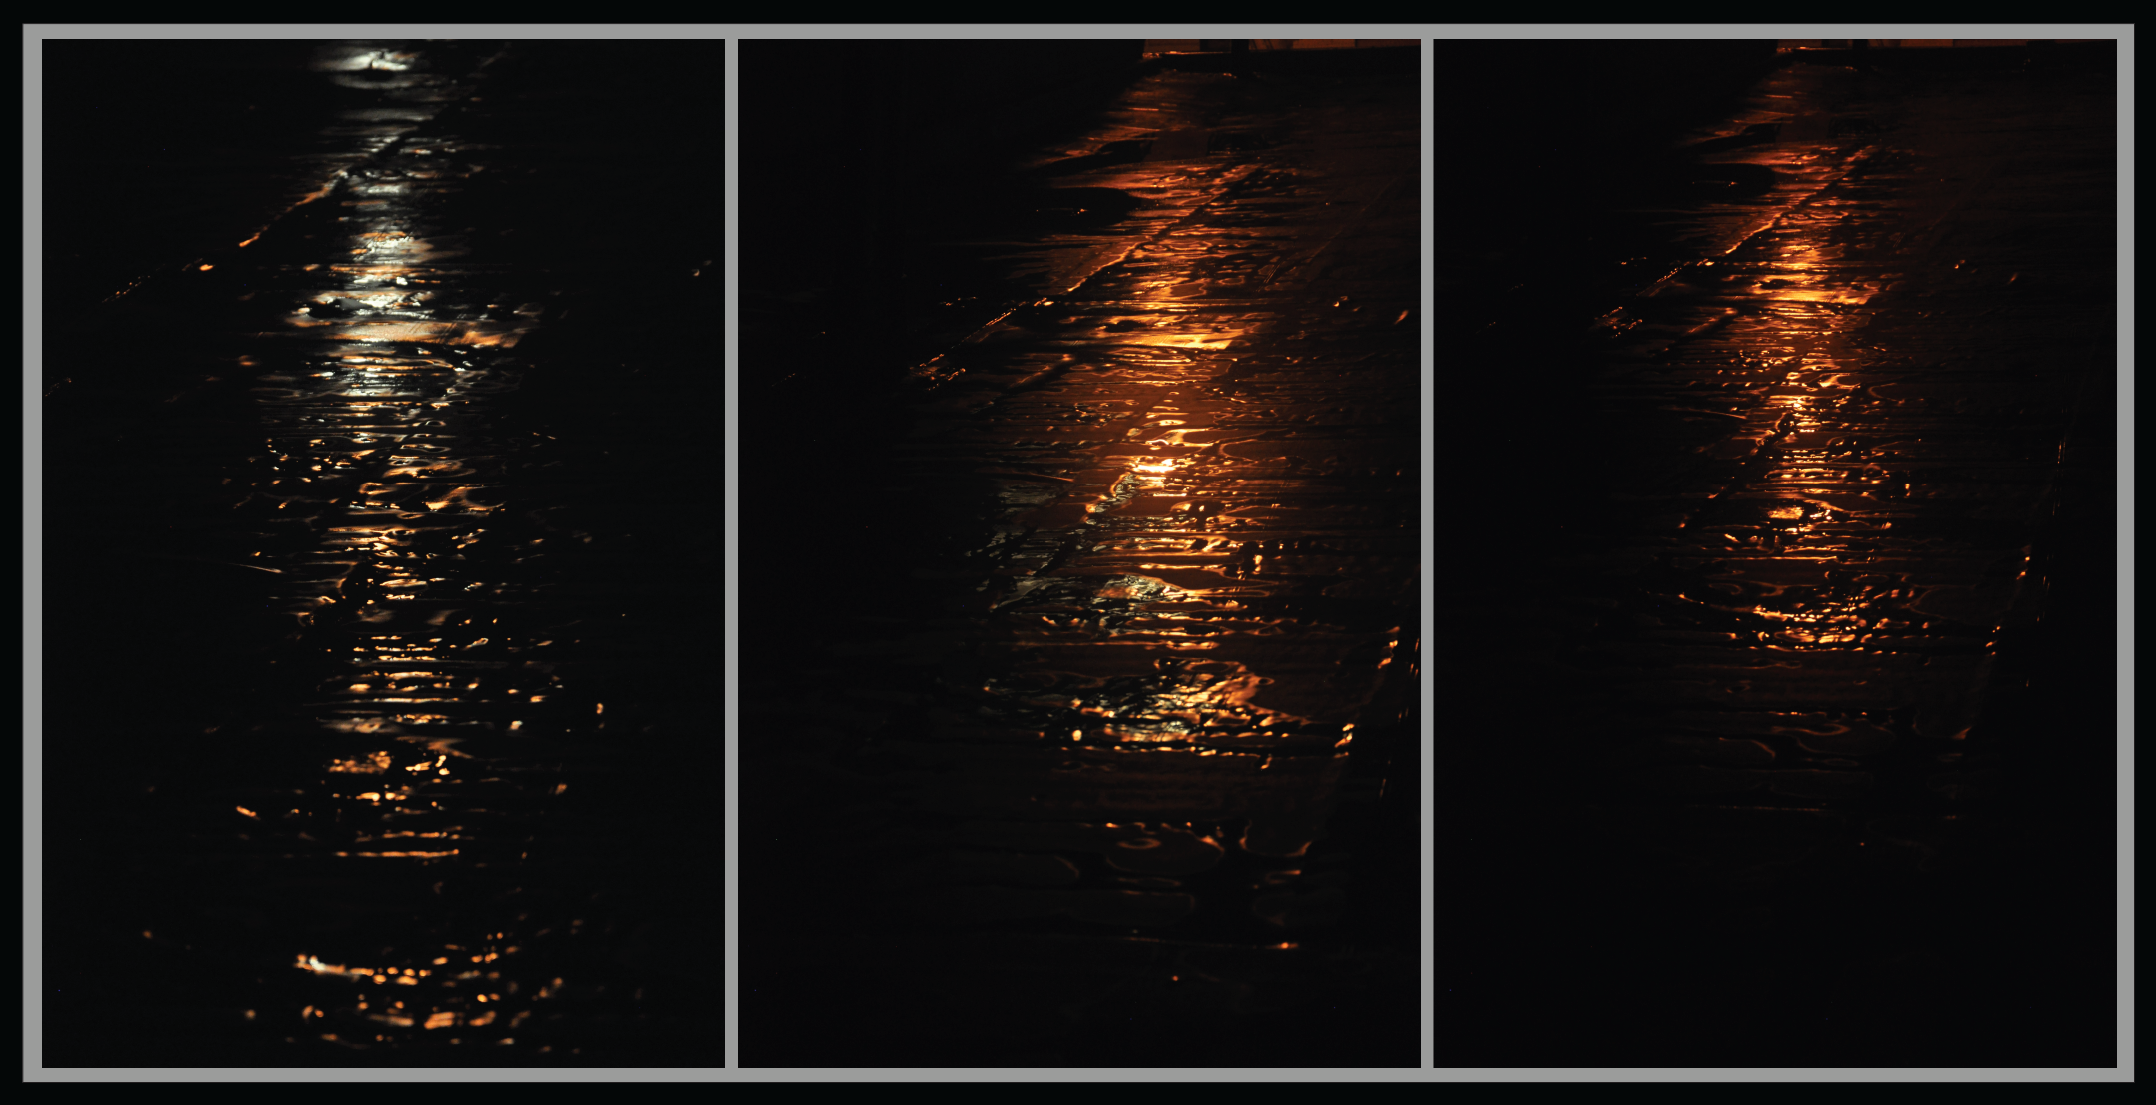
Mosaic of Mood is a Mark Rothko-inspired data visualization of the gender, age, and mental health diagnosis of the people who donated their brains to science after their deaths. The yellow color scheme represents people with no diagnosis or condition (neuropsychiatric controls). The blue color scheme represents people with a single episode of major depression. The red color scheme represents people with recurrent episodes of major depression. Increasing darkness represents increasing severity. Different hues refer to different age categories.
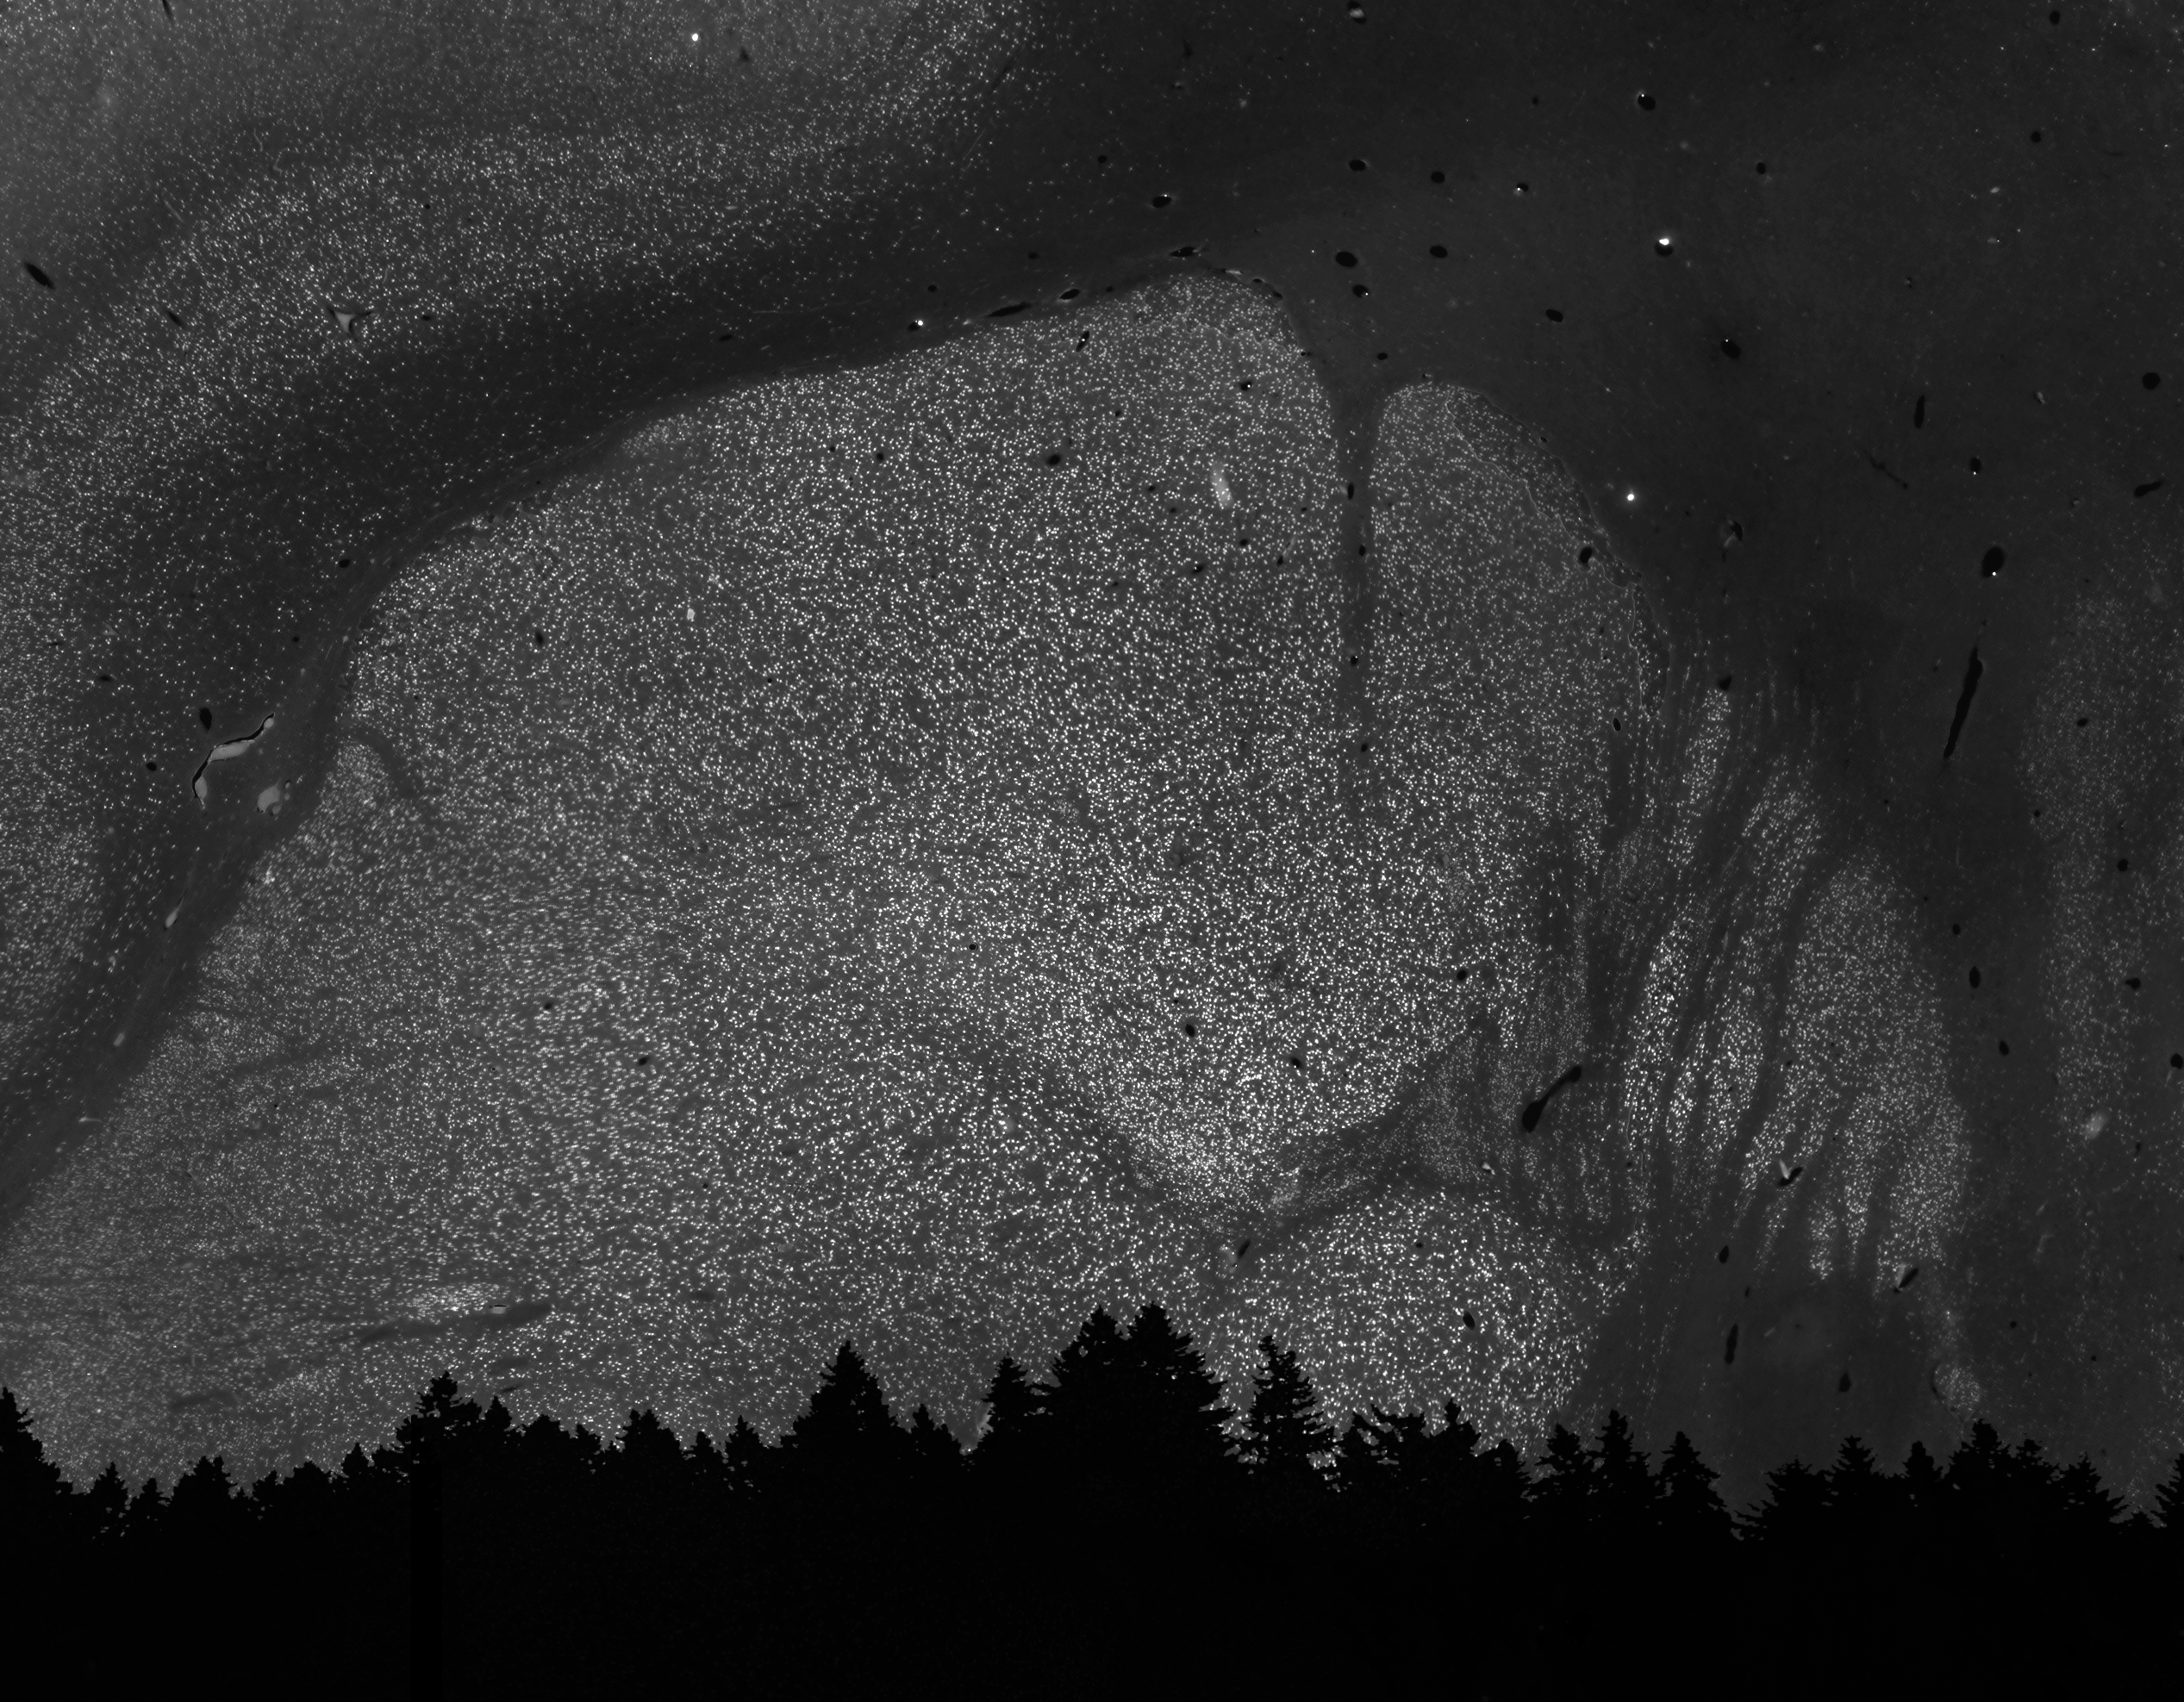
The visualization evokes the nuances and diversity in depression. I believe that this diversity can be understood at the level of brain cells. In my research, I use this valuable brain tissue to explore changes in neurons between the different colors of diagnosis categories.
Click here for an image with labels and legend included.
Presented at Mindscapes PGH 2020 fundraising exhibit.


